MySQL Transactions per Second with 3000 IOPS
Introduction
Imagine a scenario where you’ve got a high rate of transactions that need to be written to a MySQL database. A popular cluster configuration for MySQL is single-leader replication. This provides a number of benefits, including reducing load for read queries. However, it doesn’t help much with writes since a single write to the cluster must be eventually copied to every replica. Another option could be multi-leader replication, but that requires a complex setup and solutions for write conflict resolution. You can also consider partitioning the data across multiple shards that themselves are node clusters using single-leader replication. Given MySQL doesn’t natively support sharding data across multiple nodes, this requires either writing your own application logic or using external tools such as Vitess.
So there are a number of options to compare when facing a scenario with a high number of writes in terms of transactions per second (TPS). What isn’t obvious is what is considered a “high” number of writes. Is it 1,000 or is it 1,000,000 TPS? This could depend on things like what type of hardware you’ve got, how large the writes are, database indexes, etc. The goal here is to perform some write-only benchmarking on a commodity cloud MySQL instance and see what type of write performance we actually get with mostly out of the box parameters.
Test Setup
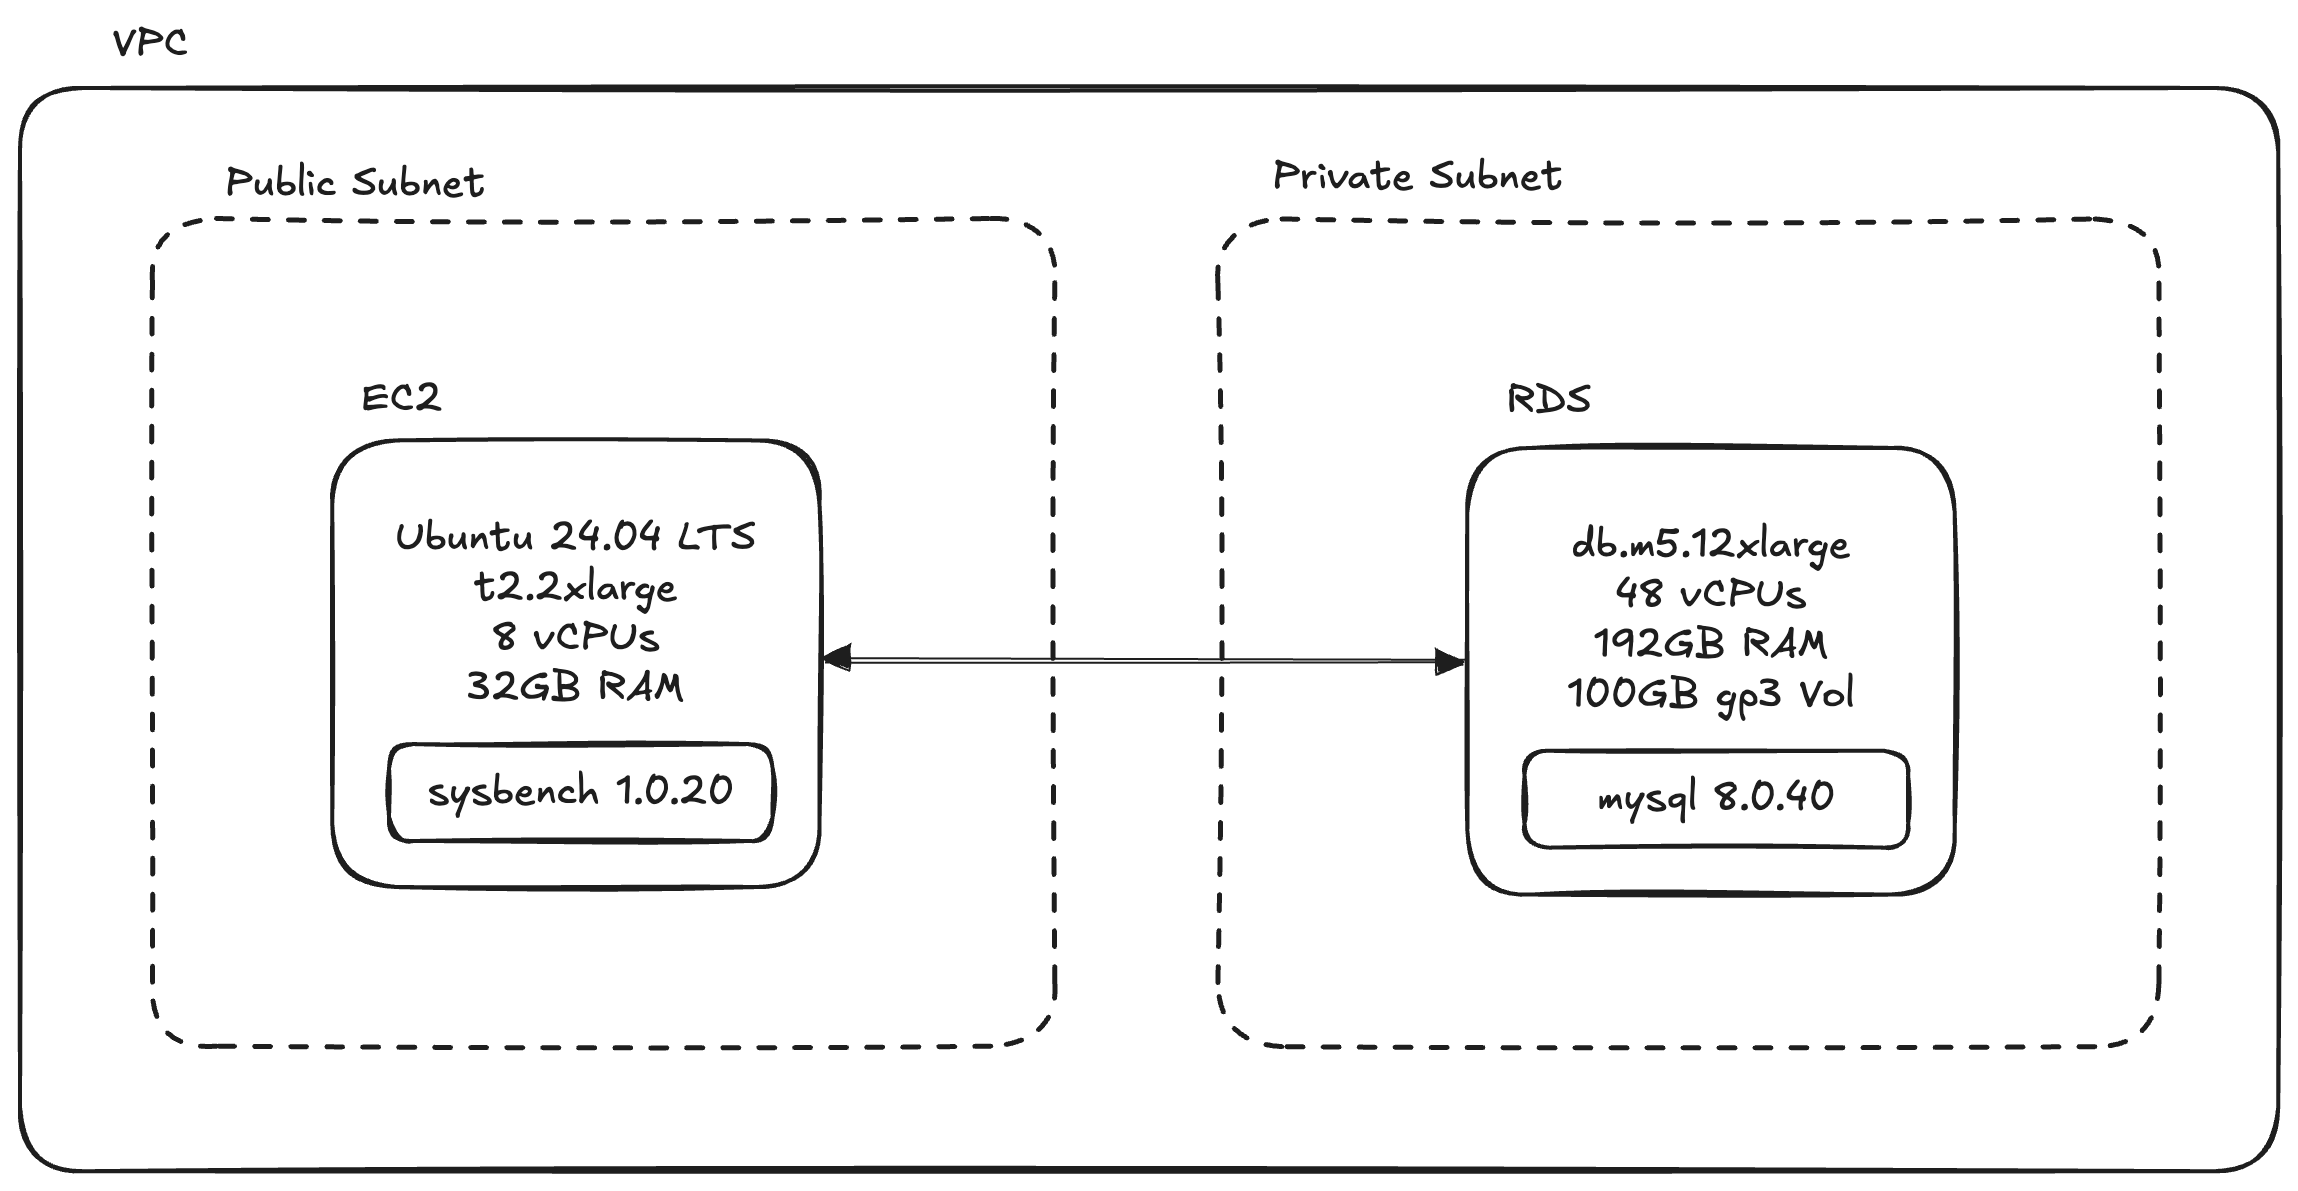
All testing was done on AWS with one EC2 and one RDS instance within a single VPC. To make it easier to get to a state of an I/O bound system, I chose an RDS instance with a 100GB gp3 EBS volume. This size of a gp3 volume has a consistent baseline of 3000 IOPS. I chose this over gp2 because I wanted to avoid IOPS bursting behavior, which could complicate the testing procedure. I also chose to keep the volume under 400GB to avoid a configuration that uses volume striping (similar to RAID 0), which can bring the capacity up to 12000 IOPS [1]. I used a db.m5.12xlarge instance size for MySQL 8.0.40 on RDS, which had 48 vCPUs and 192GB of RAM.
The deployment configuration of this RDS instance along with a connected t2.2xlarge EC2 instance is shown below. To execute the write benchmarking tests, sysbench 1.0.20 was installed on the
EC2 instance.
I used the sysbench test oltp_write_only to create a write-heavy workload on the RDS instance with the following command structure:
sysbench oltp_write_only \
    --auto_inc=on \
    --db-driver=mysql \
    --events=0 \
    --mysql-db=$DB_NAME \
    --mysql-host=$DB_HOST \
    --mysql-password=$DB_PASSWORD \
    --mysql-port=$DB_PORT \
    --mysql-user=$DB_USERNAME \
    --rate=0 \
    --report-interval=5 \
    --table_size=1000000 \
    --tables=8 \
    --threads=1 \
    --time=300 \
    run
This test was prepared with 8 tables, each with a size of 1,000,000. It was configured to run as fast as possible and to increase load, the number of threads were swept from 1 up to 2560. Each test was run for 5 minutes and averages of the results were collected.
To help achieve high concurrency during the sysbench test, the following MySQL parameter was set to avoid artificially limiting the number of allowed prepared statements at a time.
max_prepared_stmt_count = 1048576
The nofile limits in the /etc/security/limits.conf file were also increased on the EC2 instance
to enable testing with thread counts above 640. Application of these limits was confirmed by
running ulimit -a and checking the open files attribute.
ubuntu soft nofile 65535
ubuntu hard nofile 65535
For reference, here is a list of MySQL 8.0.40 parameters set. All others were default values.
character_set_server = utf8
character_set_client = utf8
sql_mode = ONLY_FULL_GROUP_BY,STRICT_TRANS_TABLES,NO_ZERO_IN_DATE,NO_ZERO_DATE,ERROR_FOR_DIVISION_BY_ZERO,NO_ENGINE_SUBSTITUTION
max_prepared_stmt_count = 1048576
Results
Upon completion, sysbench presents a set of SQL statistics that represent the total number of transactions and queries along with percentiles for latency. An example for a single thread run is shown below. In this example, the results showed 108 transactions per second (TPS) and
649 queries per second (QPS). The “other” category under queries performed corresponds to BEGIN and COMMIT transaction control statements, which are roughly 2x the number of transactions completed.
Since there was a single thread in this test, we can see that the average latency
of 9.25 ms for each transaction corresponds to roughly 1/(108 TPS).
SQL statistics:
    queries performed:
        read:                            0
        write:                           129752
        other:                           64876
        total:                           194628
    transactions:                        32438  (108.12 per sec.)
    queries:                             194628 (648.74 per sec.)
    ignored errors:                      0      (0.00 per sec.)
    reconnects:                          0      (0.00 per sec.)

General statistics:
    total time:                          300.0070s
    total number of events:              32438

Latency (ms):
         min:                                    5.48
         avg:                                    9.25
         max:                                   37.24
         95th percentile:                       11.45
         sum:                               299901.17

Threads fairness:
    events (avg/stddev):           32438.0000/0.00
    execution time (avg/stddev):   299.9012/0.00
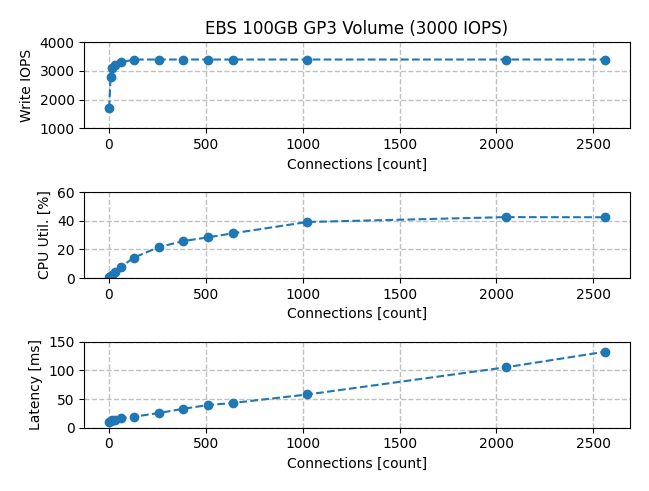
To provide evidence of an I/O bound workload, the results below show RDS instance write IOPS, CPU utilization, and average transaction latency as a function of number of connections (threads). With 128 connections the RDS instance saturated at 3400 IOPS, which is 13% above the expected limit of 3000. CPU utilization stayed below 45% for all thread counts tested up to 2560. The latency increased across the range of thread count with an increase in slope after 1024 threads where it reached a max of 133ms.
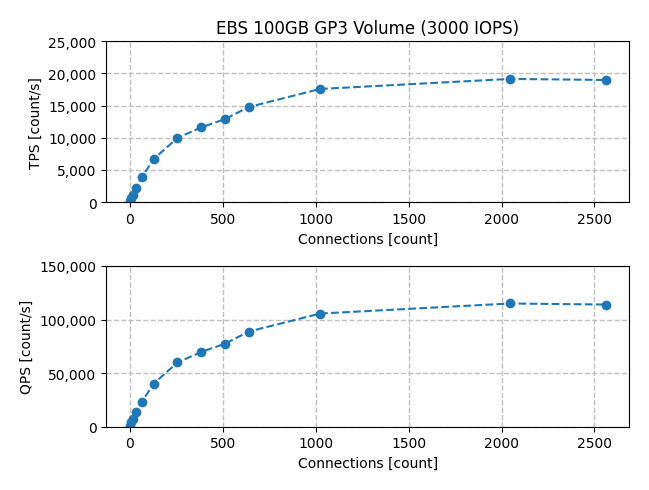
Finally, let’s look at the results of the MySQL server benchmarking for writes. At lower connection counts, there was a rapid increase in TPS and the knee point began to appear around 13k TPS with 512 threads. The results show diminishing returns at higher levels of concurrency with the maximum write throughput of 19k TPS measured at 2048 connections.
Conclusions
A db.m5.12xlarge AWS RDS instance with 3000 IOPS (100GB gp3 volume) and
running MySQL 8.0.40 was benchmarked using sysbench 1.0.20 and the oltp_write_only
test. Data taken from CloudWatch logs showed that Write IOPS saturated at 3400 and CPU utilization never exceeded 45%. With minimal configuration change
beyond default MySQL parameters, the database was able to get up to 19k TPS with a write-only workload.
Note that when the binlog is enabled, there can be up to 3 fsync operations for every transaction in MySQL as part of an internal 2-phase commit process. These writes are done on the write-ahead log (WAL) and binlog files. That means one might expect to be limited to ~1000 TPS at 3000 IOPS. However, MySQL has the capability of performing “Group Commits”, which can bundle multiple in flight transactions into a single fsync operation [2]. This could explain how we saw TPS numbers over 5x the IOPS measured on the RDS instance.
So what is a “high” number of writes for a MySQL instance? Again that depends on your specific setup. We’ve seen in this case we can squeeze 19k TPS out of an RDS instance with a 3000 IOPS specification. You can use that as a data point for your rules of thumb.